← all work case study 04 · side project

Will my street flood today?

A free, no-signup tide warning for Ho Chi Minh City. The forecast already existed — buried in government PDFs.

Nhat Hoang · Product designer, sole maker · 2026

about this one

My own project, nights and weekends. Live at trieucuong.com — every screen below is the real thing.

the setting

The forecast existed. Nobody could read it.

Two sources, one answer

The hydro-met office publishes the tide. The city publishes which streets go under at which level. Together: a forecast, in PDFs nobody opens.

Not an app audience

Shopkeepers, parents, retirees on old phones. One test: would my aunt in Nhà Bè get this in three seconds?

My role: all of it — research, design, front end, and the job that scrapes the bulletin.

what it does

One page, six answers

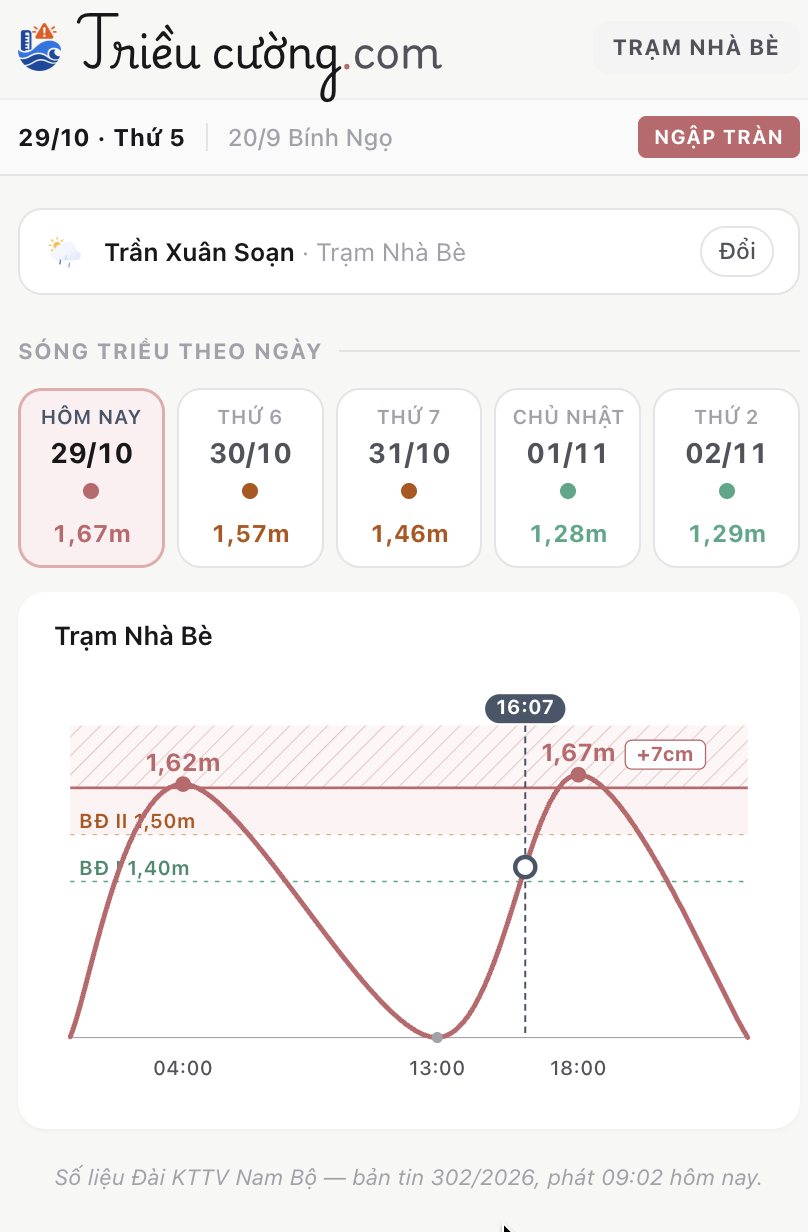
Today, in one word

Safe, rising, or flooding — for the station you are on.

Five days ahead

Each day's peak, coloured.

The curve

Today's tide against the three official alert lines.

Four map layers

Tide, heavy rain, what people reported, city cameras.

58 flood points

Each with the level that floods it, and whether today passes it.

Report in two taps

No account, no email, nothing to install.

One page, built to work the same on a phone and on a desktop — nothing to install either way.
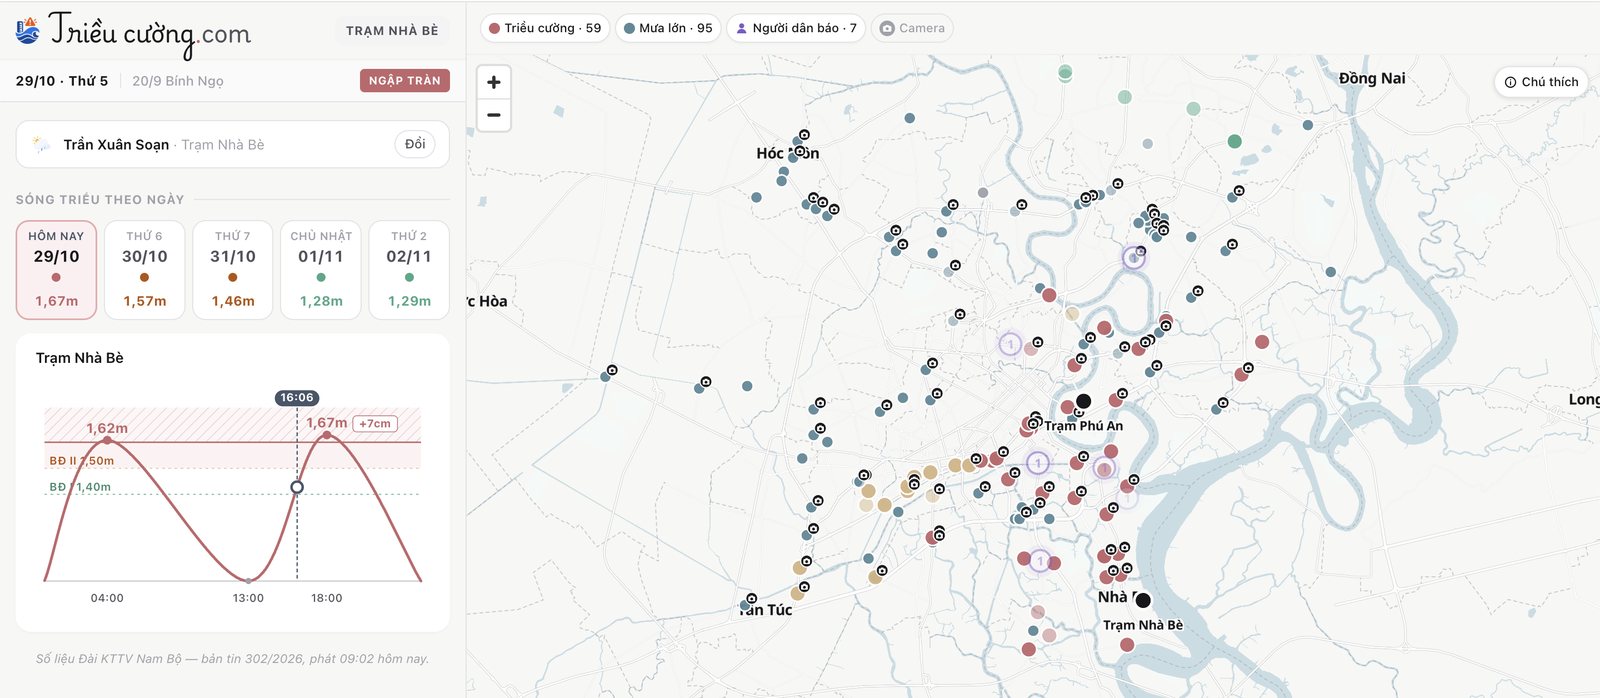
The site on a desktop: station, five days and the tide curve on the left, the map of flood points on the right
on a desktop, the map sits beside the forecast
The same page on a phone: today's peak, five days ahead and the tide curve, stacked
on a phone, the same blocks stack
the decisions

Two decisions I would defend

Each trades reach for trust. On a warning site, being wrong once is the last time someone opens it.

decision · 01

People think in body parts, not centimetres

Nobody measures flood water with a ruler. They look at their own leg: nước tới đầu gối — up to my knee.

Six levels, one tap

Ankle to over-the-head. The centimetres are generated, never asked for.

Only where you stand

A ~100m cell around the point you picked, and the form says so.
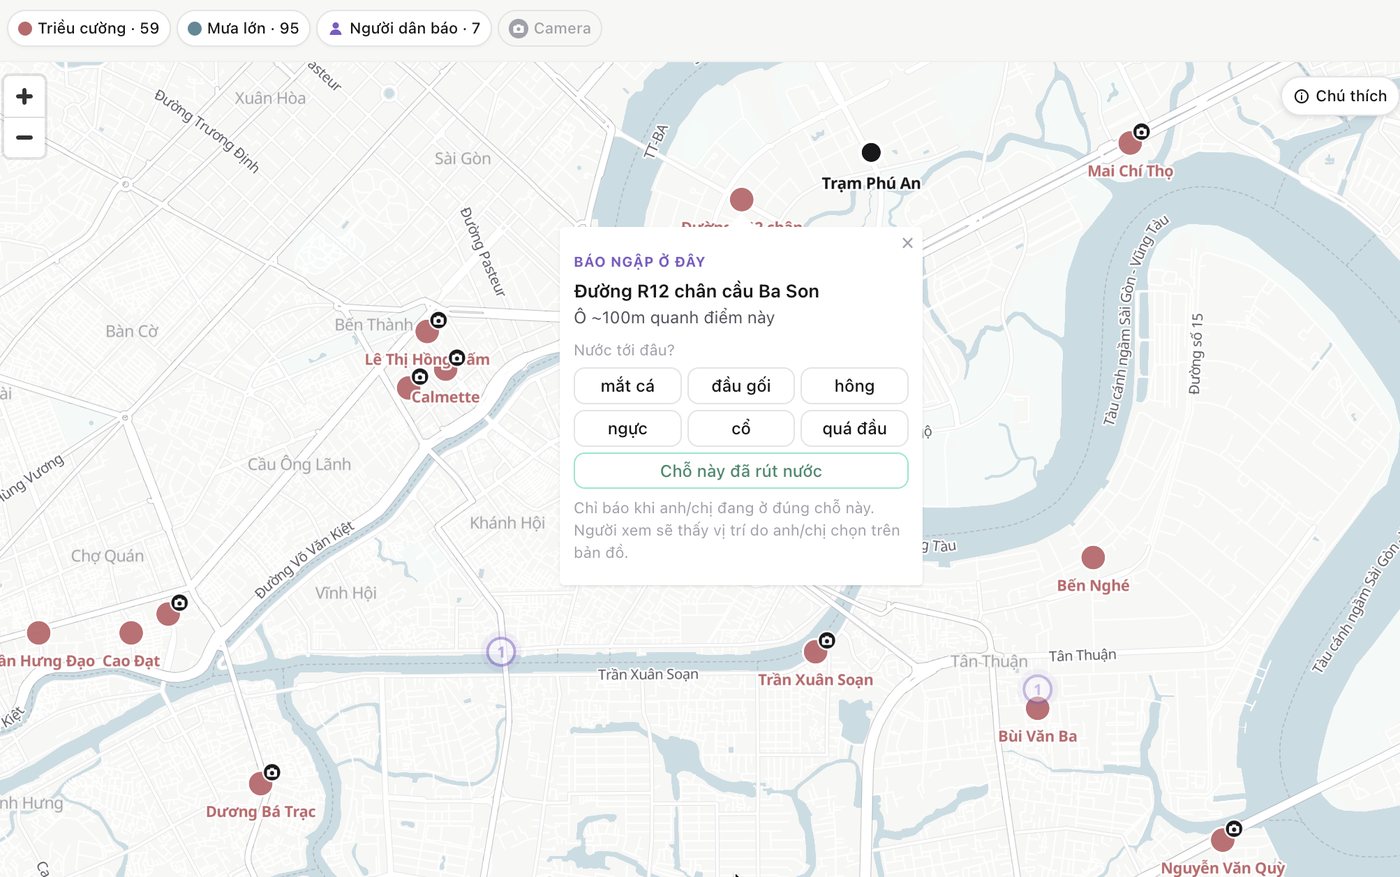
The report popup on the map: six body levels, a button for the water has gone down, and a note that you should only report where you are
decision · 02

Every pin says where it came from

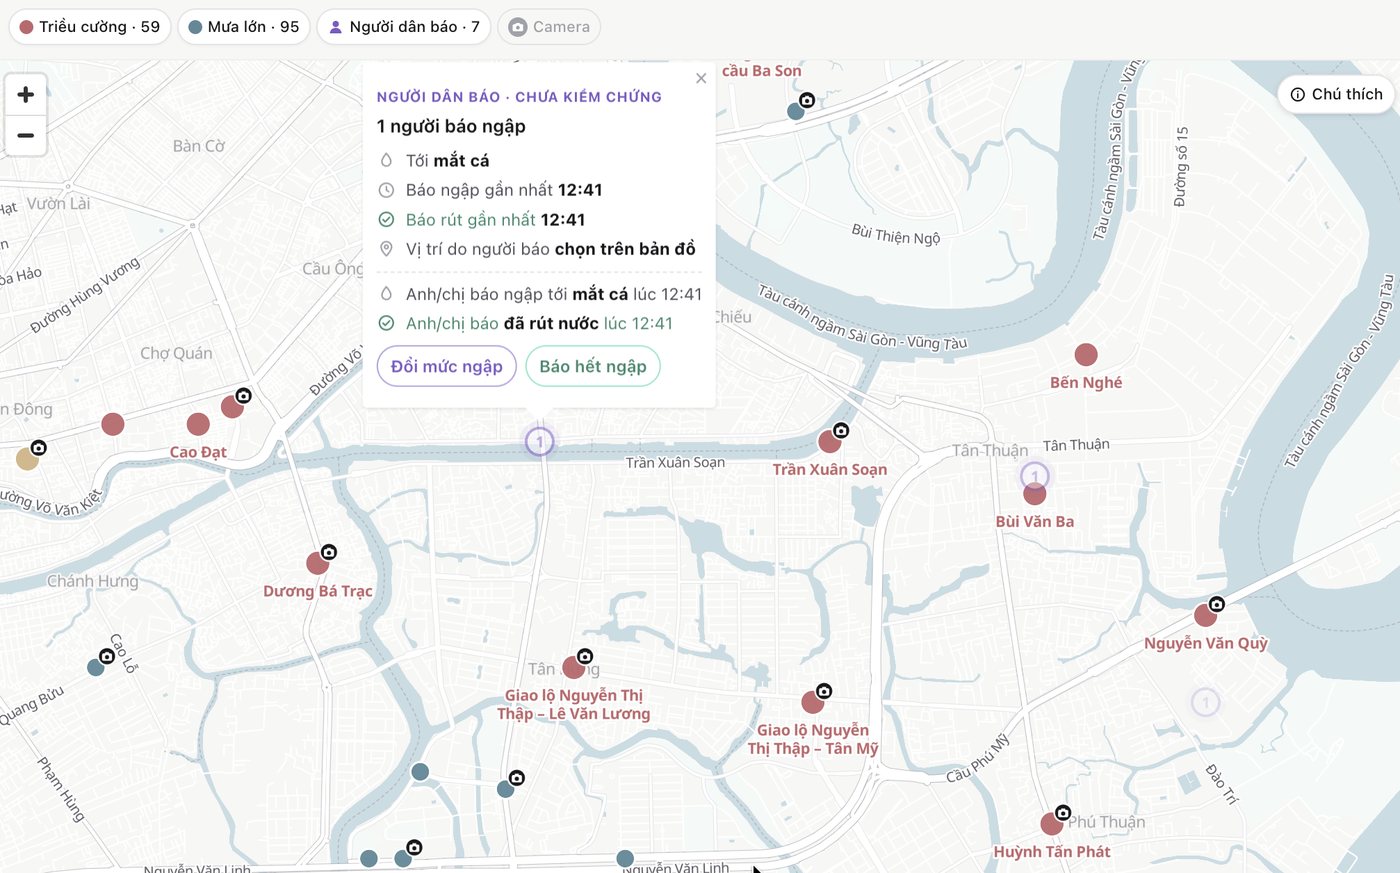
A forecast, a stranger's report and a camera are not equally certain. Drawing all three the same way would make the map look surer than it is, so each stays its own layer — and a report is marked unverified, with the time and the spot the person picked.
Tide forecast · 59Heavy rain · 95Reported by people · 7City cameras
A citizen report popup, headed unverified, showing the level reported, the time, and that the location was chosen by the reporter
a person's report, labelled unverified
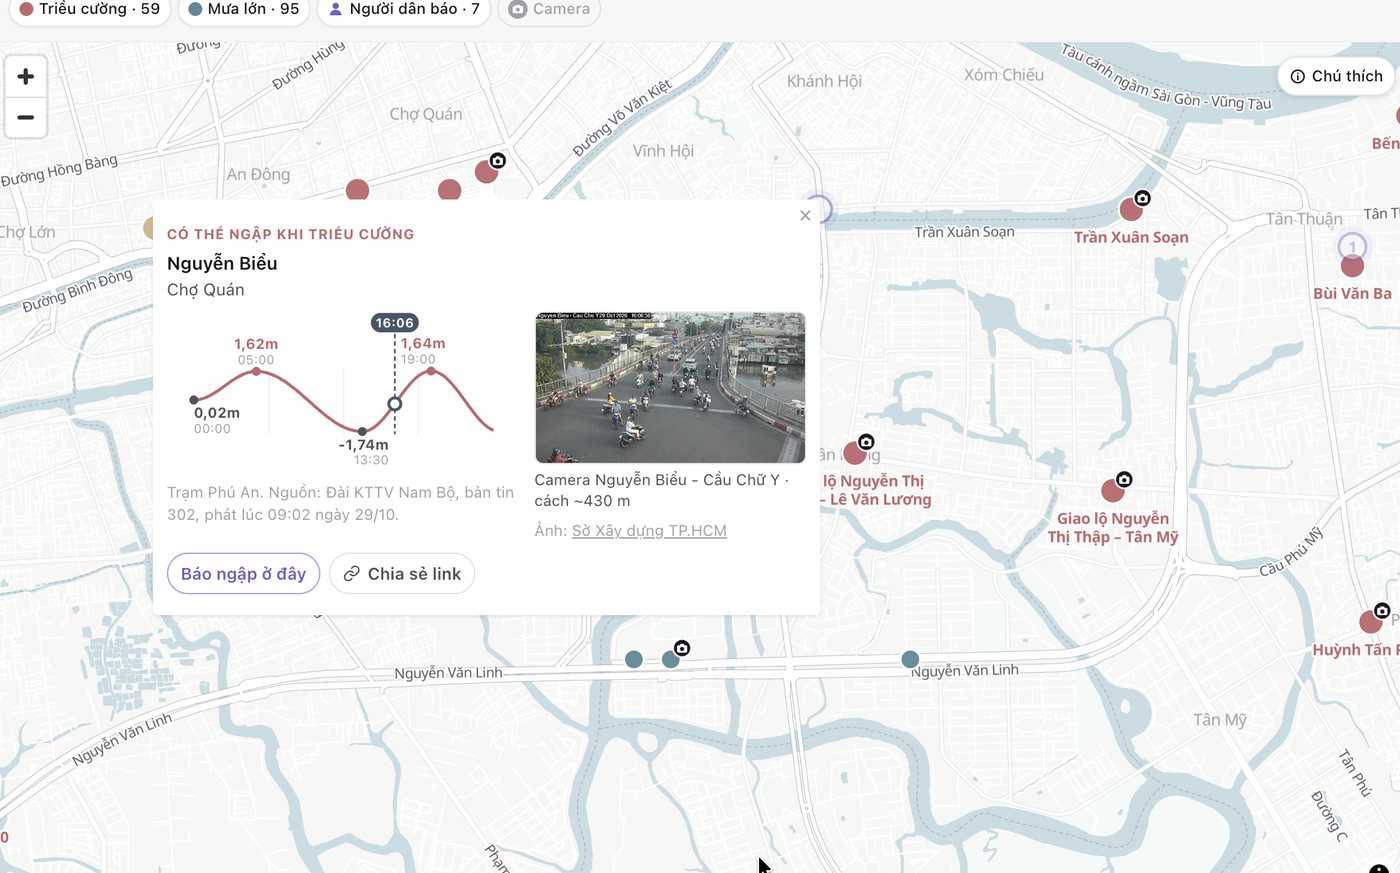
A flood point popup with its own tide curve and a live city camera image 430m away
a forecast point, with the city's camera next to it
where it is now

Running on today's bulletin

A job pulls the government bulletin through the day. Five days of tide, 58 flood points, four map layers and citizen reports are live.

in short

  • turn the data into something you can see
  • make it something you can act on
  • pin it to the point it is about